A new measure for healthy living has identified Hobart as the healthiest city in Australia, with Brisbane hovering around the national average, but declining.
The Monash University-led research used a new Environmental Quality Health Index (EQHI) which combines 12 factors, such as air quality, green spaces, climate and socioeconomic conditions, to evaluate how these factors relate to mortality risks.
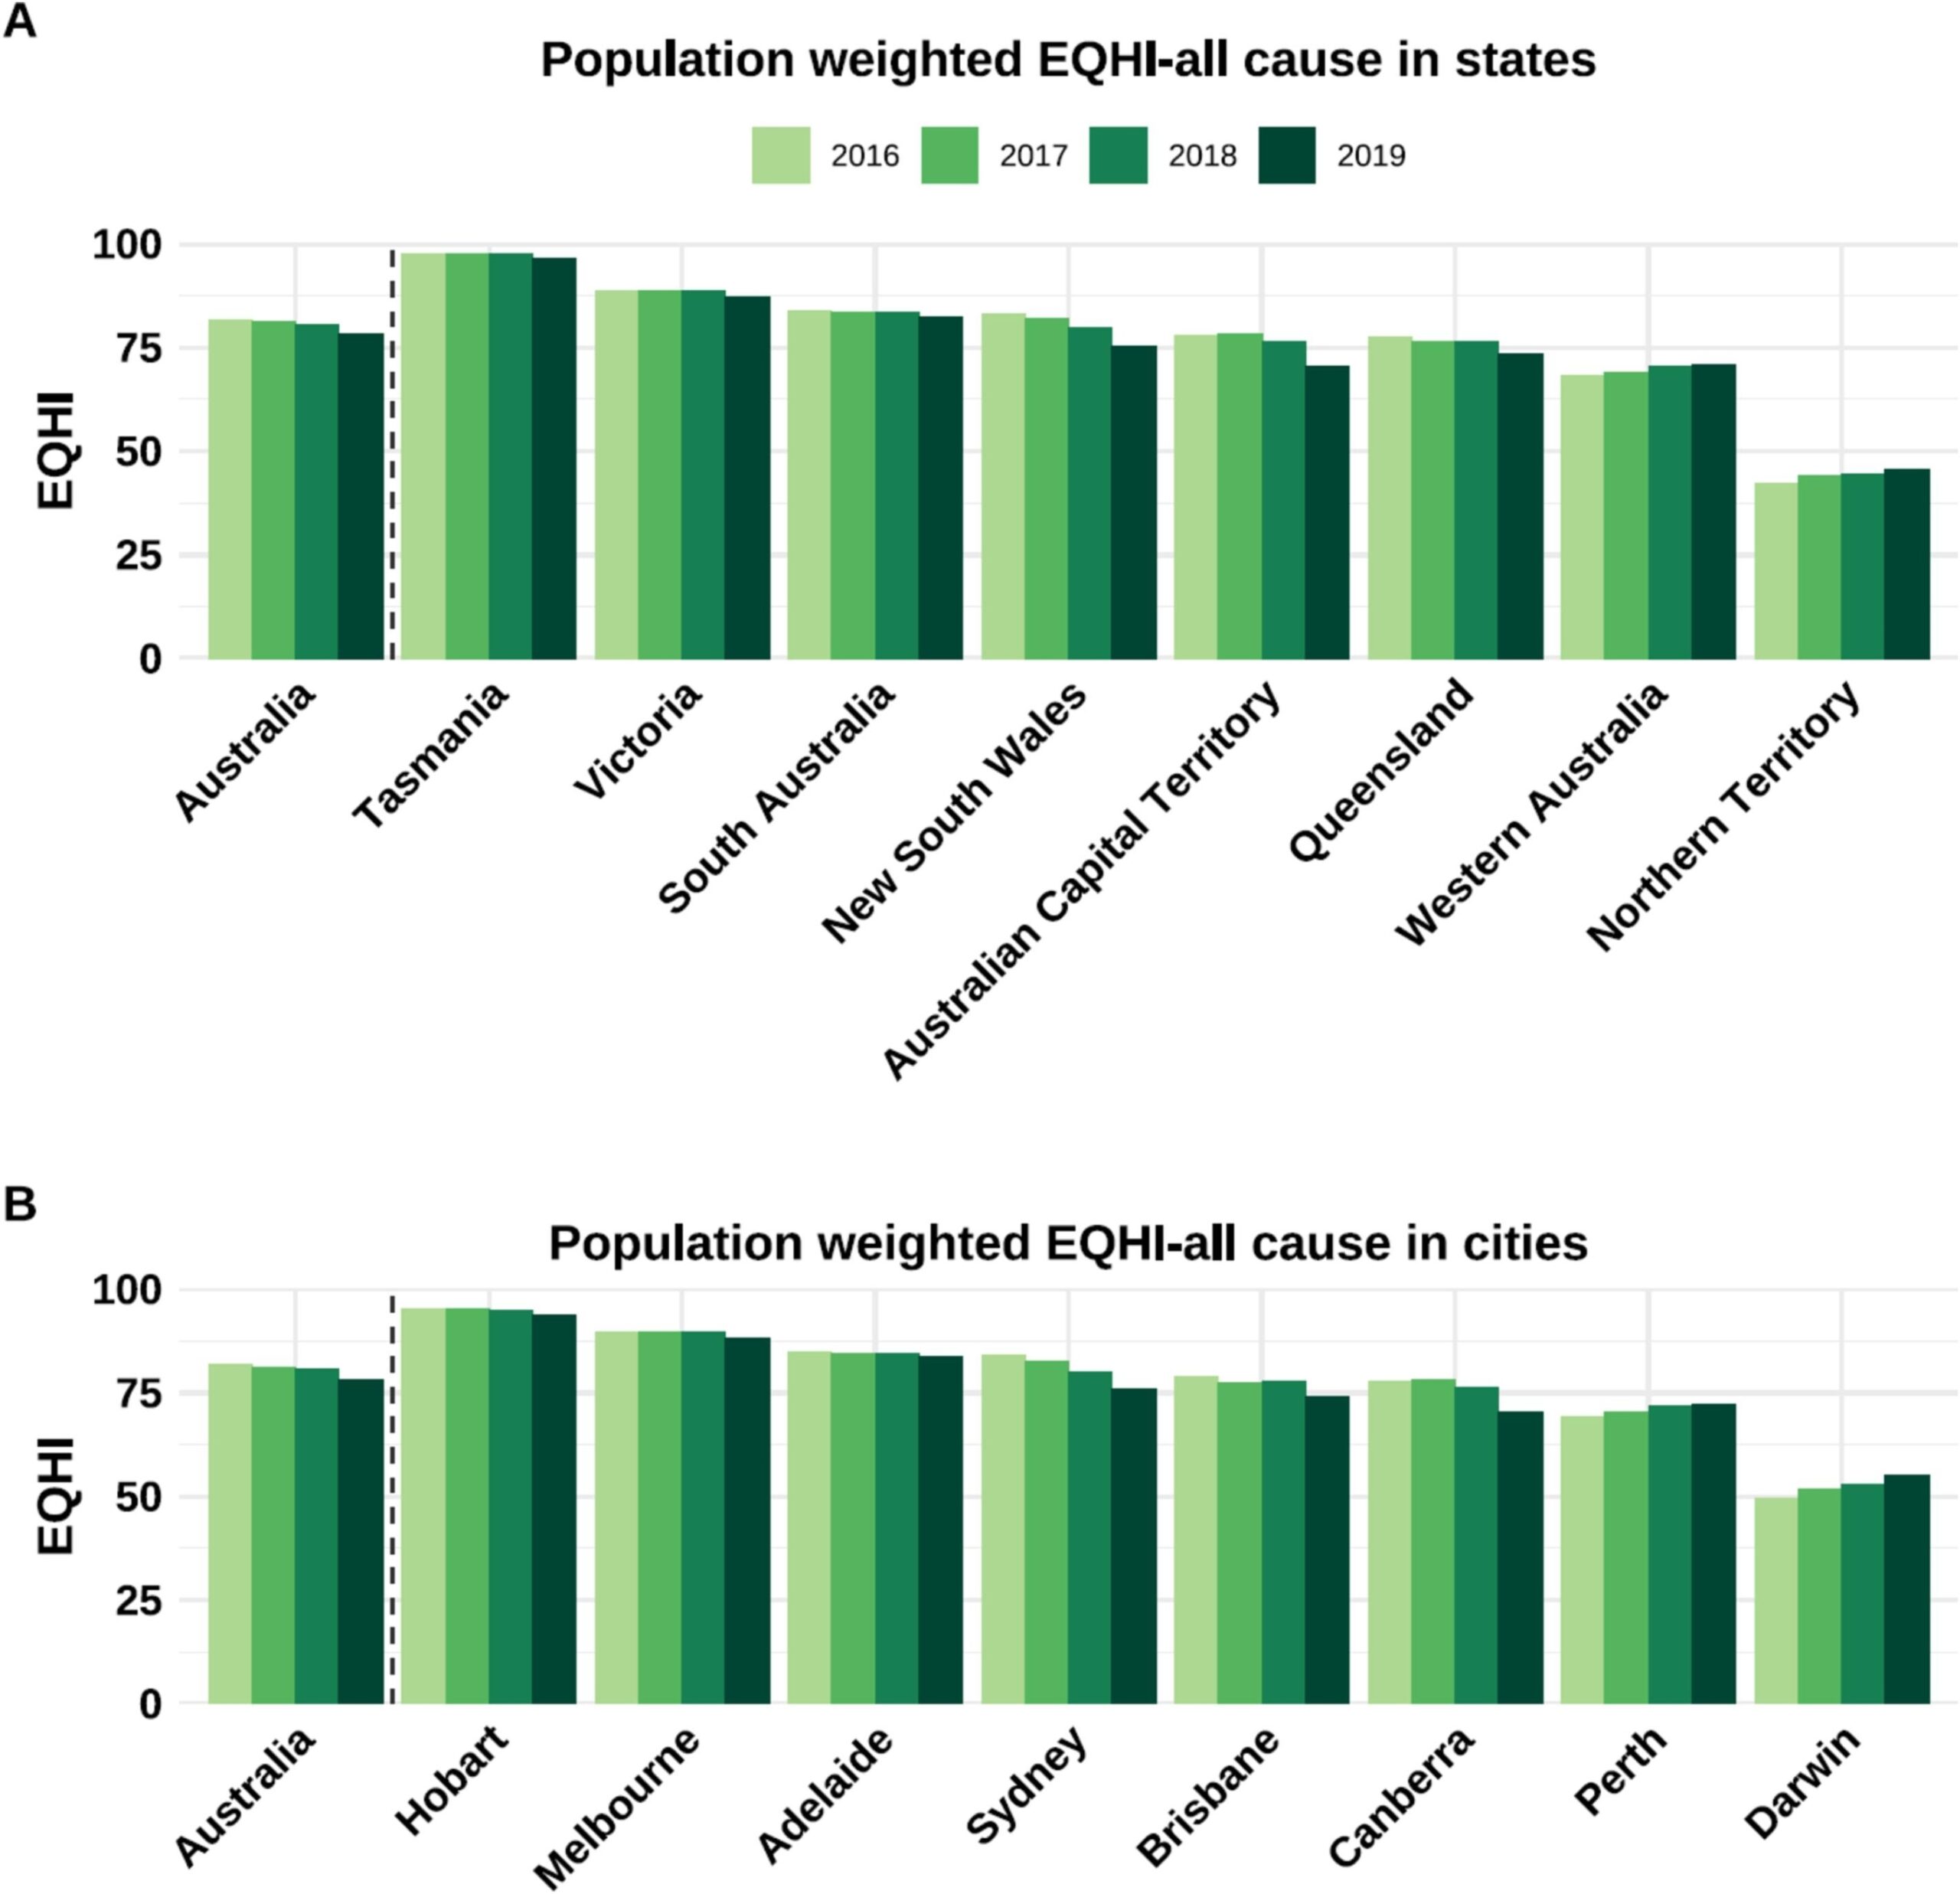
Senior author and Distinguished Professor Yuming Guo said Tasmania and Hobart were the healthiest state/territory and capital city to live in, while the Northern Territory and Darwin were rated the unhealthiest.
Professor Guo said Australia’s south, east and southwest coastal regions generally scored higher than inland and northwest regions on a scale of zero to 100, with higher numbers indicating better environmental and health conditions.
“Hobart, the capital of Tasmania, had the highest overall EQHI,” he said.
“The differences were significant, with Hobart showing exceptionally good results, while Darwin had the lowest scores, reflecting poorer environmental and socioeconomic conditions.”
Professor Guo said that from 2016 to 2019, the proportion of areas with highest EQHIs decreased by six percent, however, more than 70 percent of Australians still lived in high-scoring areas.
“When accounting for population distribution, this study found that scores improved in Perth and Darwin, decreased in Sydney, Canberra and Brisbane, and remained stable in Melbourne and Adelaide over 2016-2019,” he said.
Professor Guo said the EQHI could be integrated into policy and public health frameworks by disseminating results to policymakers to inform environmental improvement and health interventions, educating the public and stakeholders on how to interpret and use the EQHI, collaborating with local governments and organisations to implement targeted measures in low-scoring areas.
The 12 environmental and socio-economic factors:
- Fine particulate matter (PM2.5).
- Ozone (O3).
- Green space: Normalised Difference Vegetation Index.
- Night time light.
- Mean temperature in summer.
- Mean temperature in winter.
- Temperature variability in summer.
- Temperature variability in winter.
- Relative humidity.
- Building density.
- Road density.
- Socioeconomic status: the Index of Relative Socio-Economic Advantage and Disadvantage.
Read the full study: Identifying the healthy places to live in Australia with a new environmental quality health index.