An online tool which maps key cancer statistics shows Australians living in rural and remote areas face lower survival rates than their city cousins.
A new version of the Australian Cancer Atlas, shows the impact of cancer varied substantially depending on where a person lived.
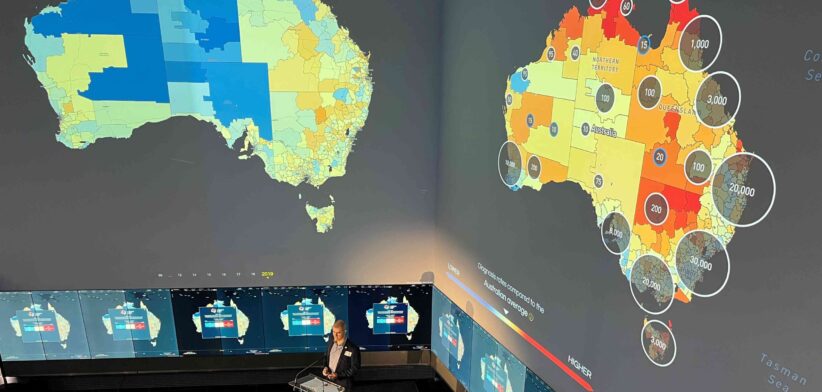
Released by Cancer Council Queensland in partnership with QUT, the online map showed that while some patterns varied for different cancer types, the consistent pattern was that Australians living in regional and remote areas experienced poorer survival than those living in urban areas.
QUT Distinguished Professor Kerrie Mengersen, statistician and director of the QUT Centre for Data Science, said the updated tool was critical in helping define rural and regional health care planning.
“The Australian Cancer Atlas provides an enhanced view of what the geographical disparities are, and highlights where the impact of cancer is greatest,” Professor Mengersen said.
“Now we have the data, the next step is understanding the ‘why’, then informed changes can be made to reduce these disparities.
”By using the Atlas in conjunction with the newly released Australian Cancer Plan we can empower policymakers, advocates, and communities to make decisions for better health outcomes for all Australians.”
Cancer Council Queensland’s Professor Peter Baade said Cancer Atlas 2.0 provided unique information about the extent and characteristics of these geographical patterns, which was crucial to motivate the next step of understanding why these disparities exist.
“There is substantial evidence that, when it comes to cancer, where you live really matters. Our research demonstrates the disparities faced by Australians living in regional and remote areas have not improved over time,” Professor Baade said.
“The atlas shows which areas have above average risk factors for cancer, which areas have low screening or testing rates, higher rates of cancer diagnoses, lower rates of some treatments, and which areas have poorer survival rates.
“Users can also relate these patterns to where healthcare facilities are located across the country.
“While we don’t know the specific reasons for this gap, it is likely some combination of the behaviours of people living within those areas, along with availability and access to health services, contributes a substantial component.
“We hope this Atlas motivates investigations to uncover more of these reasons.”